What we deliver
Intelligence you can take to the board.
A clear view of treasury maturity, estimated financial opportunities and the priorities that warrant management attention.
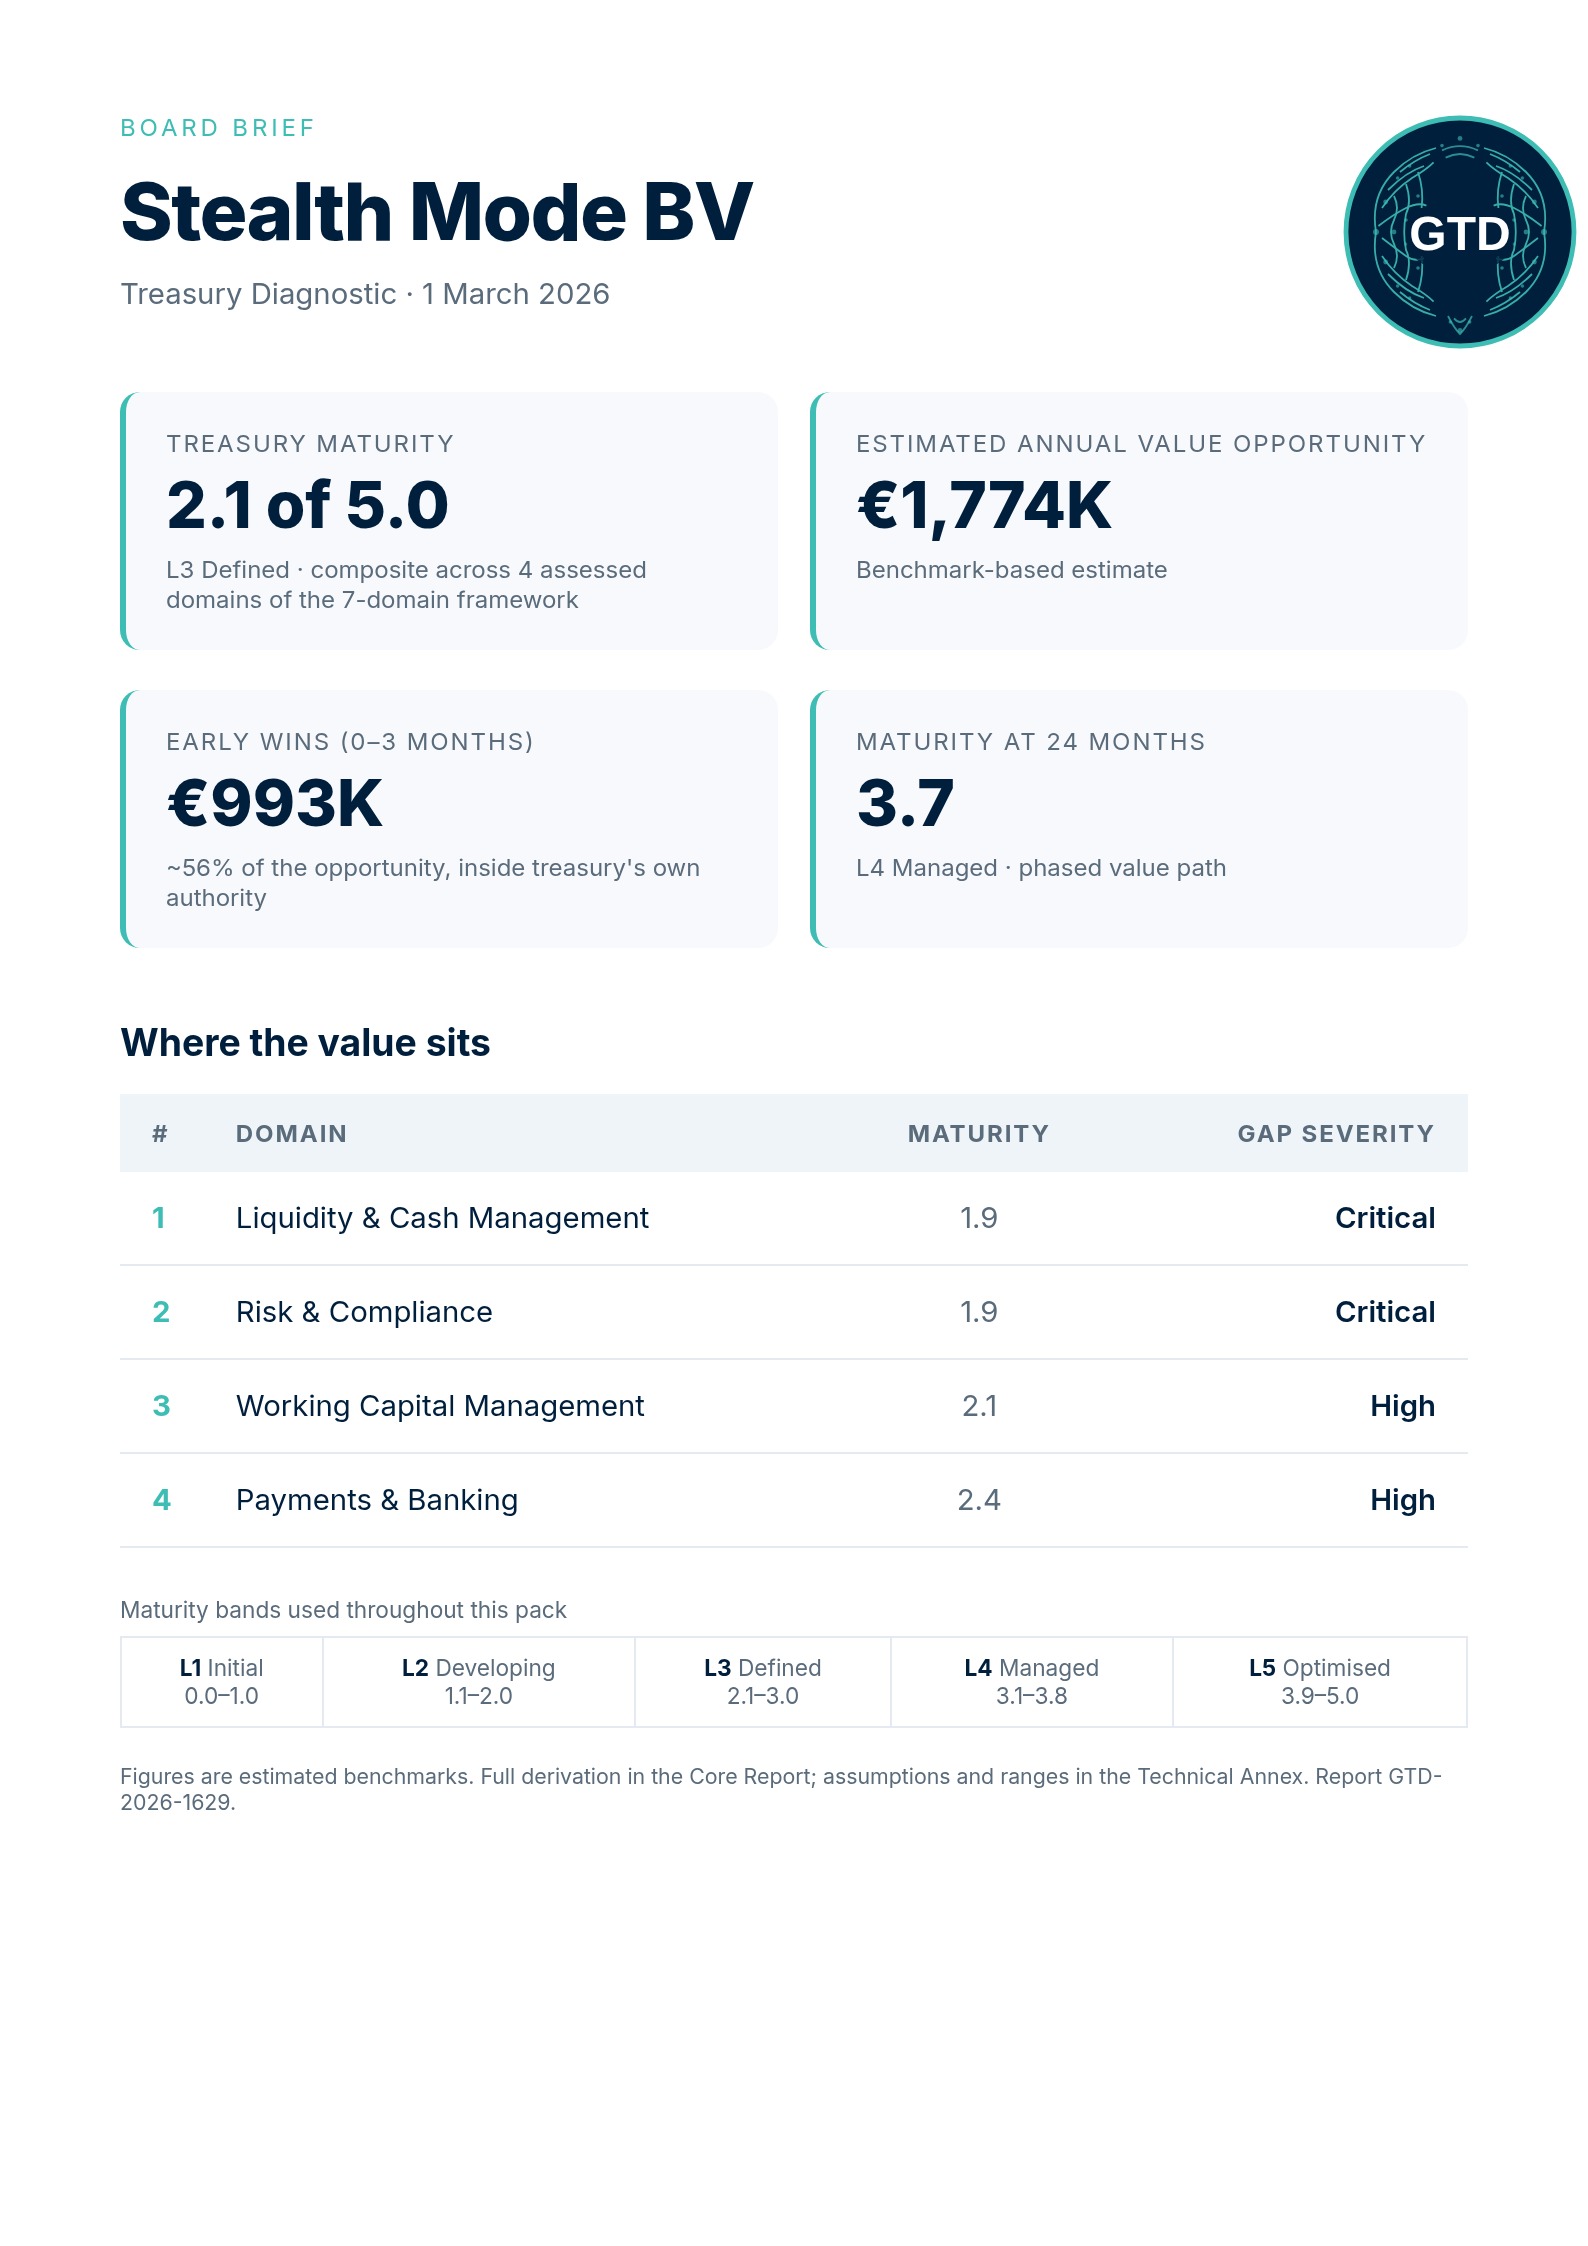
Illustrative analysis — not actual client results. Sample layout may differ from your selected scope.
A board-ready diagnostic comprising a Board Brief, Core Report and Technical Annex. Report length varies with scope and available inputs.

From findings to decisions.
01
Board Brief
Executive context, maturity position and estimated value at stake for board discussion.
02
Core Report
Domain findings, priority opportunities, near-term initiatives and a phased transformation roadmap.
03
Technical Annex
Calculation logic, reference inputs, scenarios, assumptions and analytical dependencies.
What supports the financial analysis?
Inputs, reference assumptions and calculation logic support Conservative, Base and Optimistic scenarios. Findings distinguish potential financial benefit from operational, strategic and risk considerations. Estimates are not guaranteed or realised savings.
Estimated opportunities, stated with assumptions.
Where the evidence supports it, findings are expressed as estimated annual euro impact. The chart shows selected components from the illustrative sample report — the same structure your report uses.
Cash Optimisation
€414K
FX Risk Reduction
€256K
Bank Fee Savings
€197K
Early wins · 0–3 months
€993K
Total annual opportunity
€1,774K

Choose Your Scope
Four foundational domains, or an expanded view across all seven. Both scopes use the same maturity framework and report structure, with findings tailored to the assessed domains.
| Assessment domain | Core | Complete+ |
|---|---|---|
| Liquidity & Cash Management20 questions | Included | Included |
| Payments & Banking20 questions | Included | Included |
| Working Capital Management20 questions | Included | Included |
| Risk & Compliance20 questions | Included | Included |
| Digital Assets & Innovation11 questions | —Not included | Included |
| AI & Fraud Prevention8 questions | —Not included | Included |
| Payment Ecosystem Strategy8 questions | —Not included | Included |
| Maturity questions | 80 | 107 |
The same maturity framework applies to both scopes. Core assesses four domains; Complete+ adds three. Financial and company-profile inputs are additional to the maturity questions.
Explore our methodology or discuss the right scope.
Discuss your treasury priorities.
Scope, required inputs and delivery arrangements are confirmed before your assessment begins. Pricing is shared on request.
Request a Diagnostic ProposalEnquiry records are separate from diagnostic responses. Privacy Statement · Frequently asked questions